Need Help W Google Sheets!(Excel->Google Sheets)
Replies
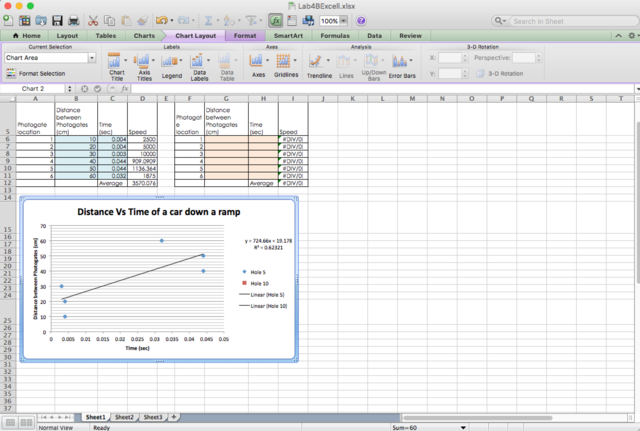
I have a document in Excel, that needs to be transferred to Google Sheets. I have no idea how to work both, and no idea what I'm doing. What i am asking if anyone can help me out? It's two sets of data with the same x and y axis, but I want different trend lines present. I can share the sheet document with you and will give you 250 CSC as a thank you if you can help me out! Thank you!~~~~ Here's what the excel sheet looks like:
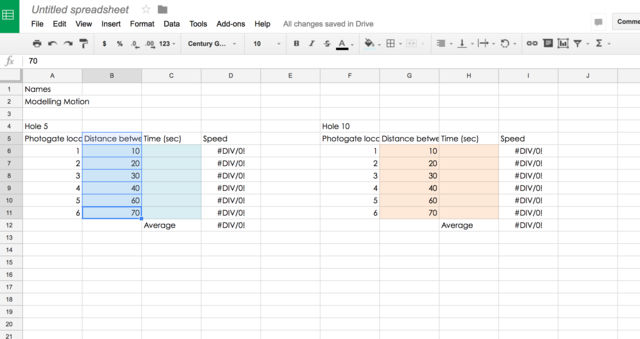
 and here's what it looks like in sheets:
Cleared by staff, oversized
You can convert any Excel file to Google Sheets easily. You just have to have the .xlsx (this is the file extension for MS Excel, btw) file in Google Drive, right click it, then choose to open in in Google Sheets. Voila, converted!
As for the second problem, I will assume that what you want to do is to represent two tables in a single line graph. It looks like you already know how to make a graph for one table, which is great because it won't be really hard from here. You just need an extra step.
In making a graph you need to select your values, right? To add the representation of another data set, just add the values from that data set into the selection.
 (Click the image for full view.)
Make sure that the values that you added are the ones that changed (the dependent variable).
(Click the image for full view.)
Make sure that the values that you added are the ones that changed (the dependent variable).